Learners' statistics
Overview
| Parameter | 2023 | 2024 | 2025 |
|---|---|---|---|
| Total course visits | 637 | 833 | 1353 |
| Total Arduino visits | 113 | 135 | 326 |
| Total Blender visits | 110 | 255 | 253 |
| Total cooking course visits | . | . | 87 |
| Total laser cutting visits | . | . | 16 |
| Total Processing visits | 409 | 443 | 608 |
| Total female visits | 83 | 120 | 154 |
| Total male visits | 554 | 713 | 1199 |
| Unique female visitors | 16 | 30 | 37 |
| Unique male visitors | 85 | 93 | 120 |
| Total minor visits | 586 | 788 | 611 |
| Total adult visits | 39 | 45 | 25 |
| Unique minor visitors | 75 | 92 | 75 |
| Unique adult visitors | 24 | 32 | 17 |
- 'Total course visits' is the amount of courses visited. If a learner visits two courses on a day (e.g. the cooking course and the Blender course), this counts as two visits
- 'Total
[something]visits' is the amount of courses visited by[something](can be male, female, adult or minor) If a[something]visits two courses on a day (e.g. the cooking course and the Blender course), this counts as two visits - 'Unique
[something]visitors' is the amount of unique/different[something](can be male, female, adult or minor) that visited one or more courses. If a[something]visits two courses on a day (e.g. the cooking course and the Blender course), she is still counted as 1 unique person - The dot (
.) means 'Not applicable', as these courses did not exists then and/or were not formally measured then
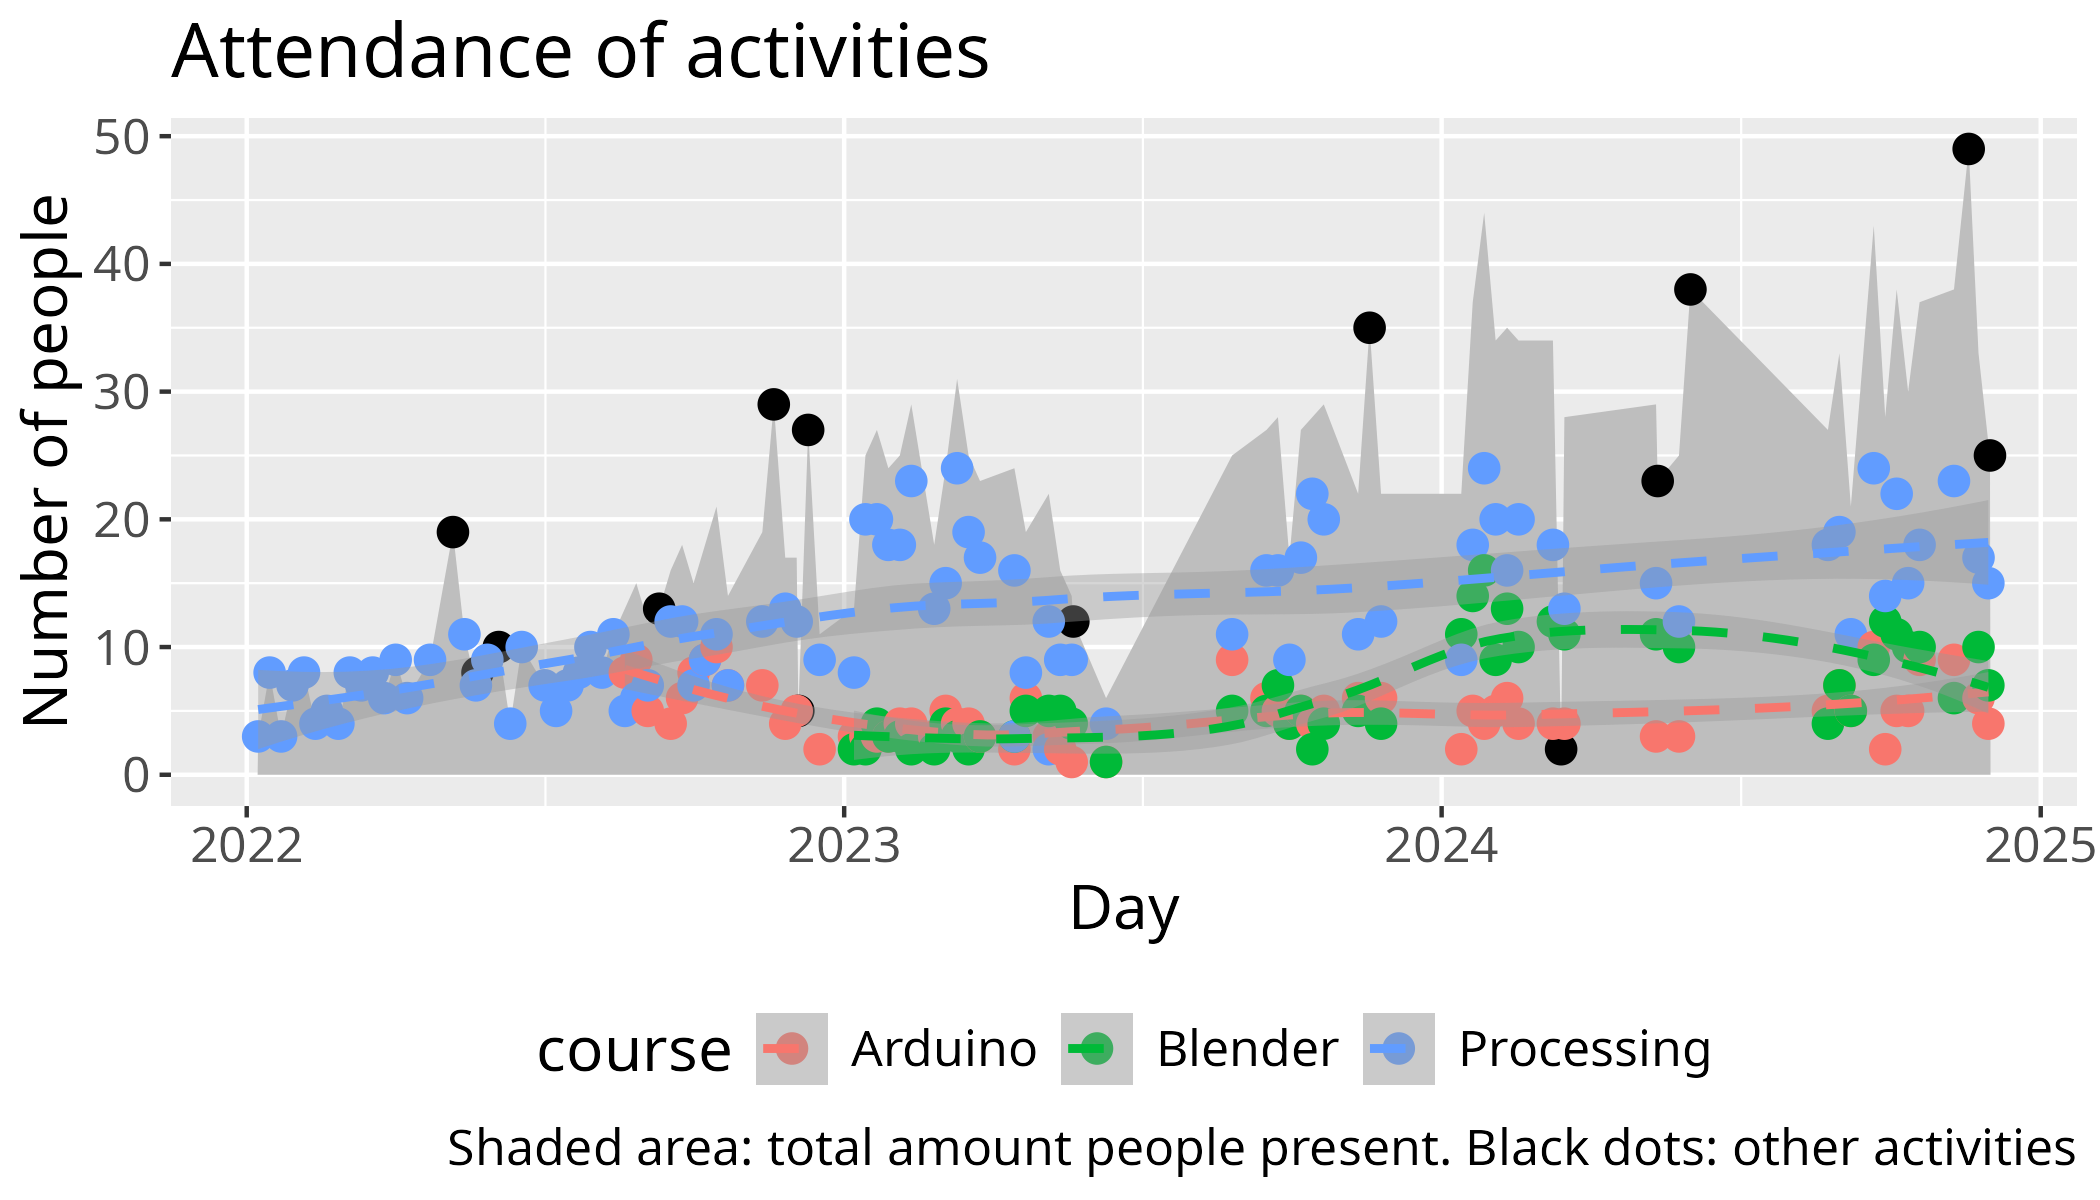
Data and figures
Data:
As a plot:
Predictions:
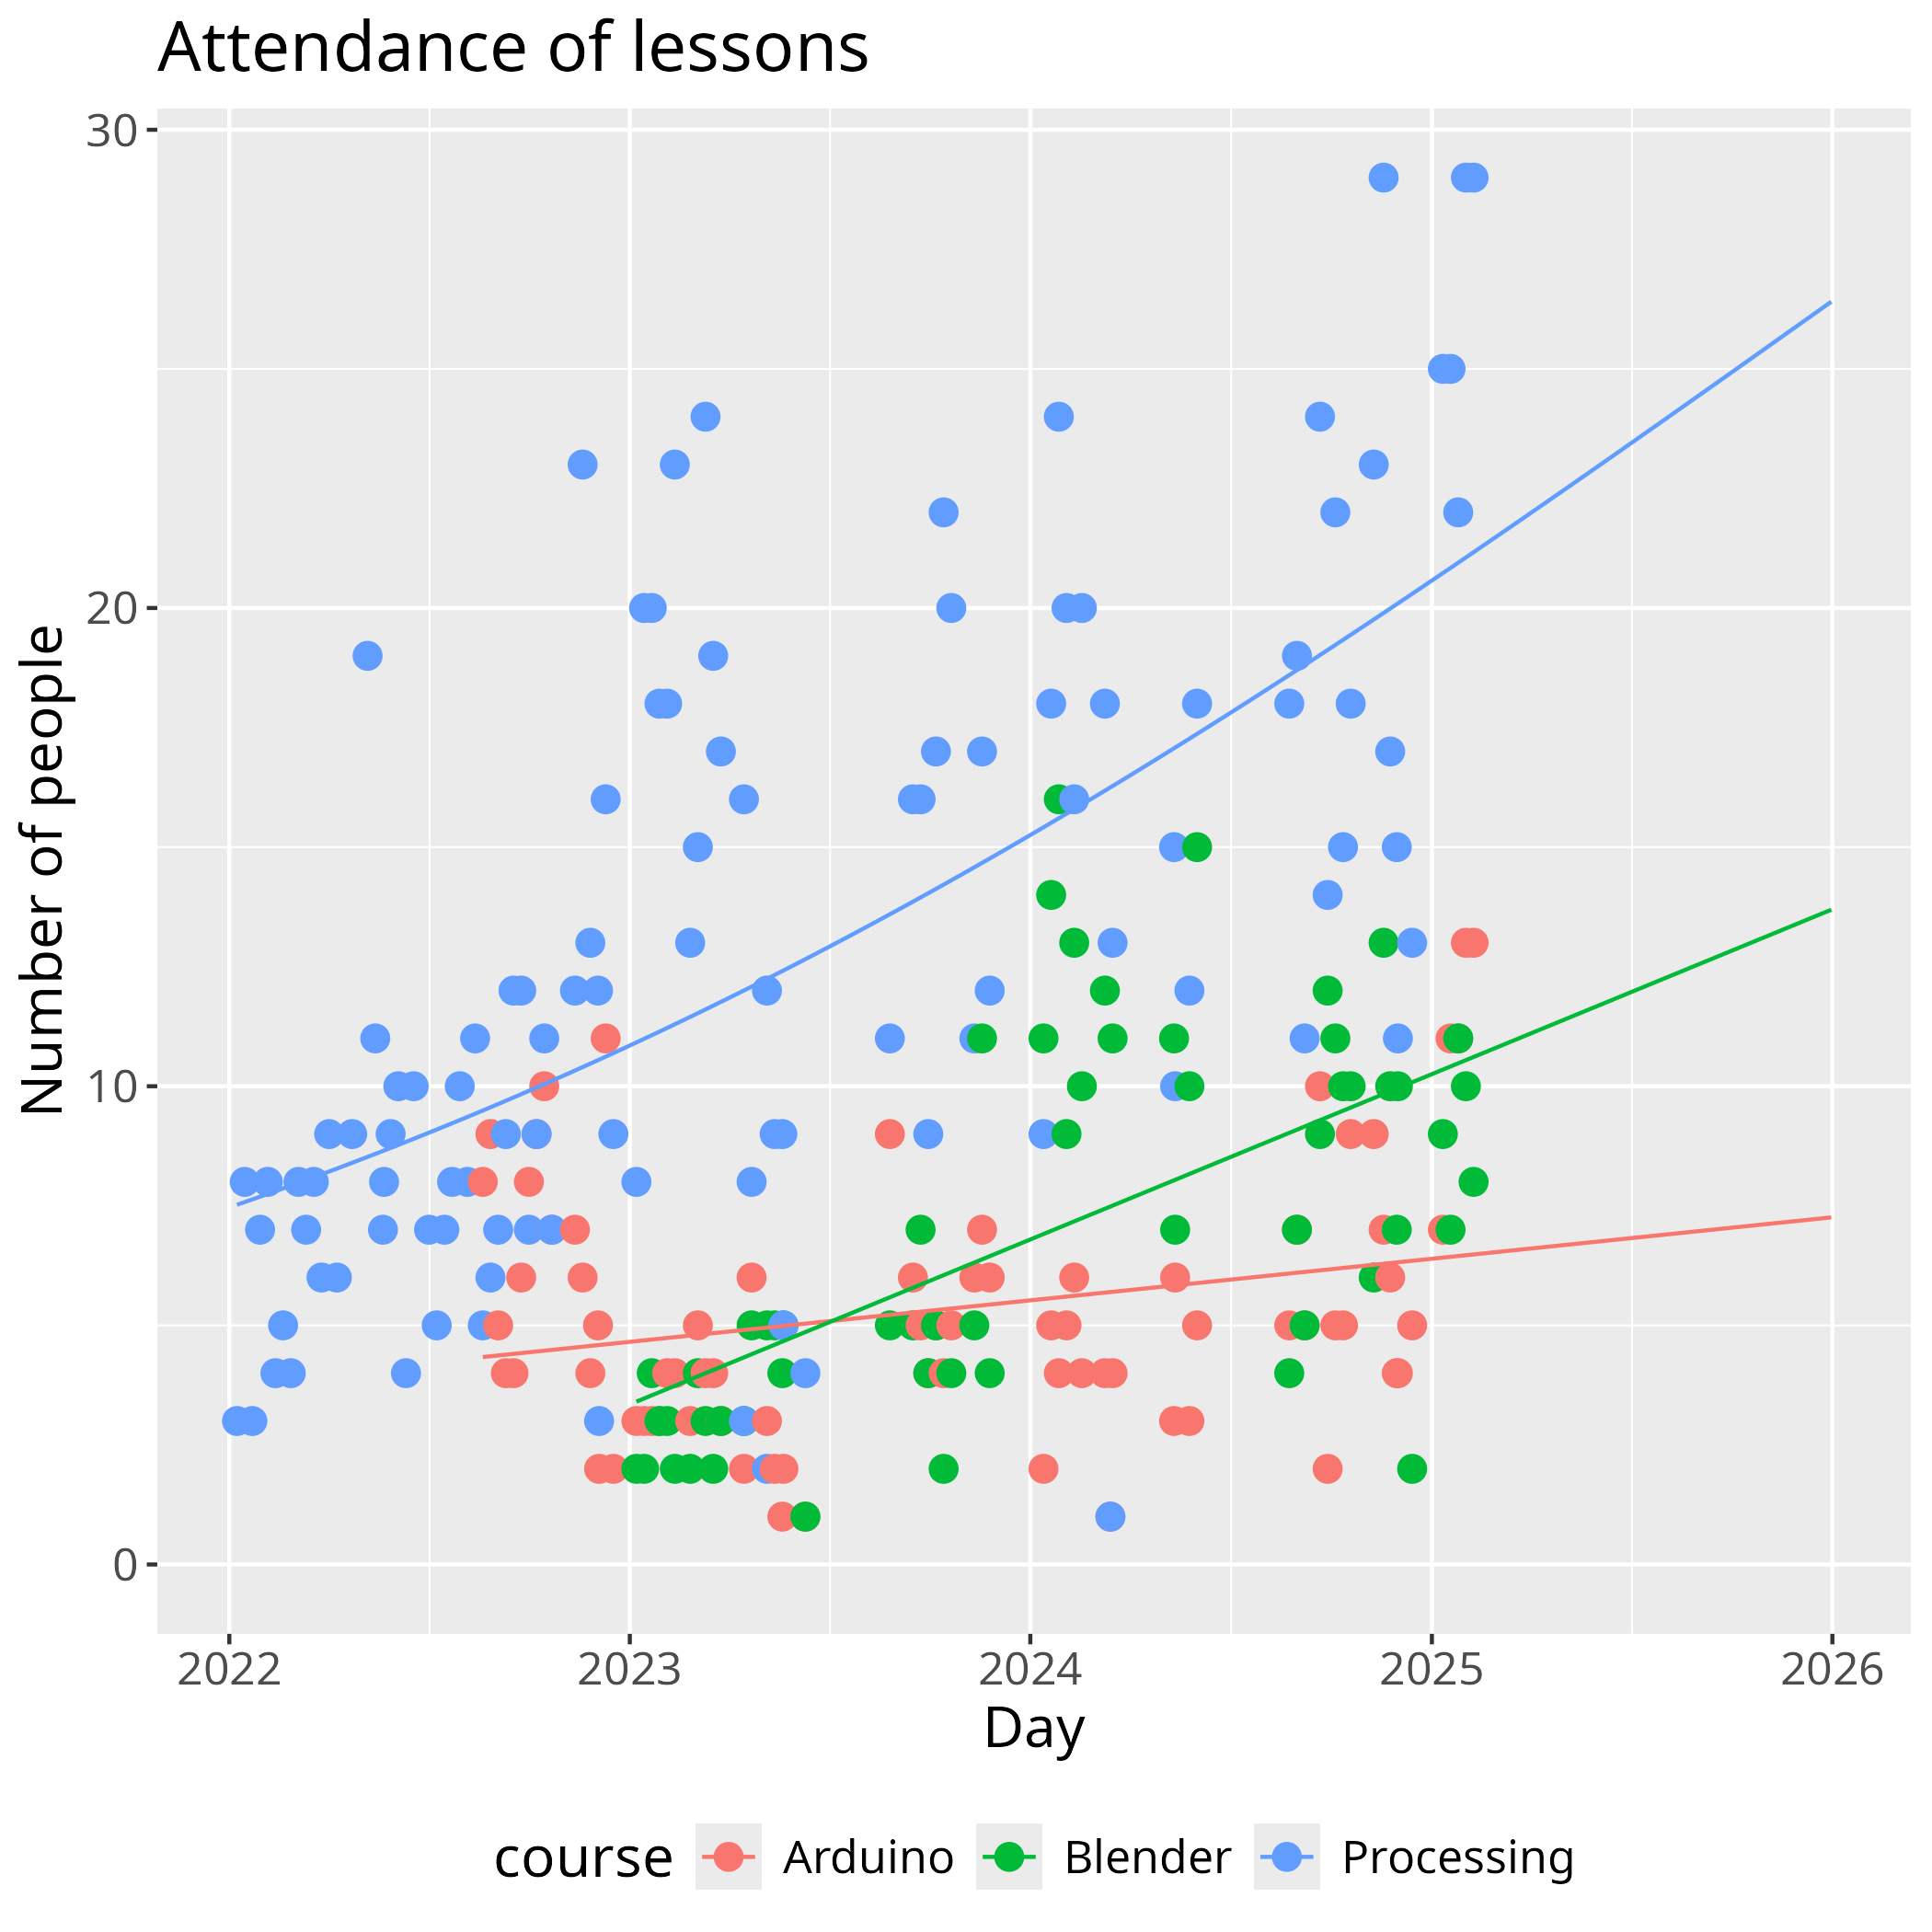
Predictions 2025, using a logistic model if it would apply, else using a linear model.
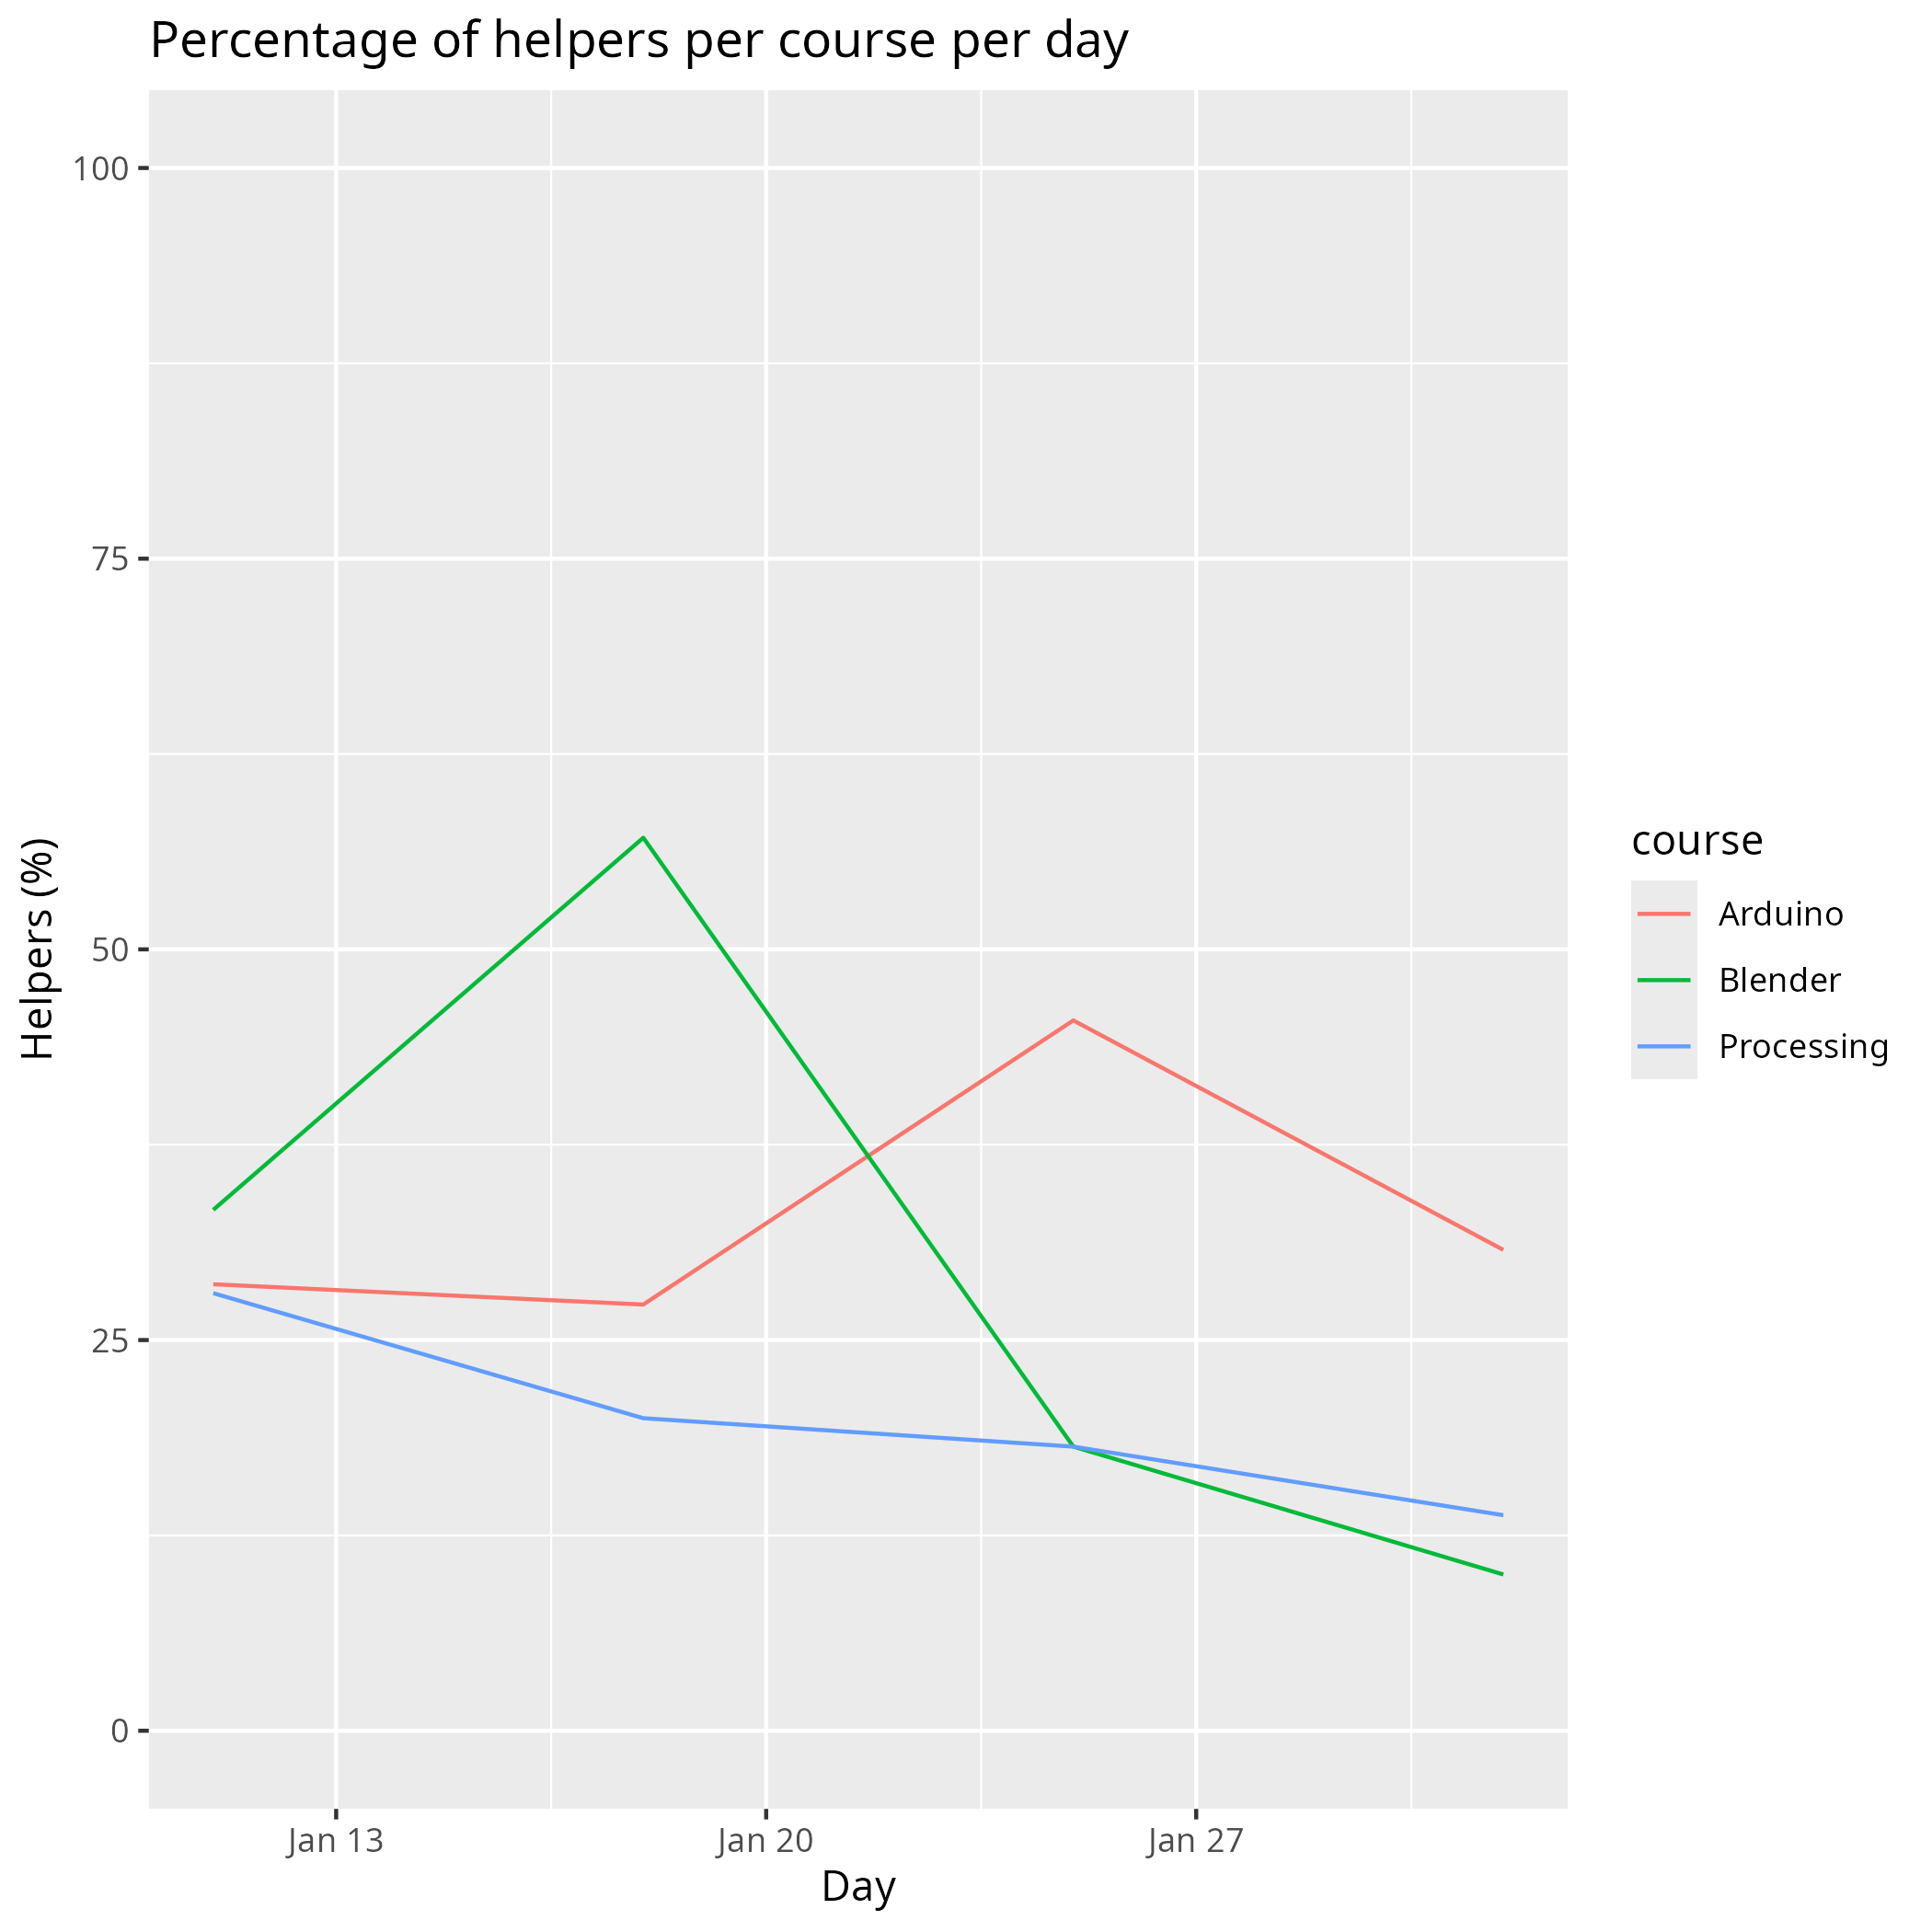
Percentage of learners willing to help a new learner: